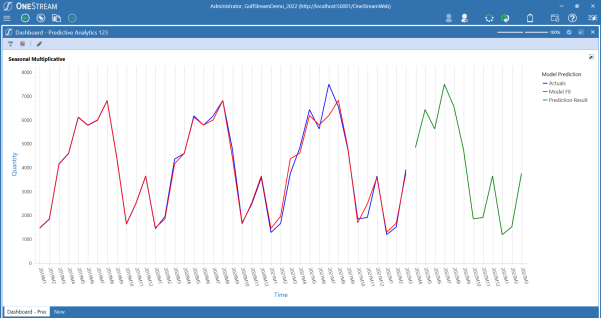
The Title will display the model type that is run for the account.
The Axes will always be labeled as Quantity and Time. The Quantity axis will scale to the given line item. The Time axis will do the same in a year-month format. For example, 2022M3 references March of 2022.
The Legend on the right-hand side of the graph displays the three line types shown. Actuals refers to the historical data that was selected in the model template. Model Fit shows the line of best fit for the historical data. Prediction Result is the official forecast produced by the model.
NOTE: The gap between the Model Fit/Actuals lines and the Prediction Results is not actually a gap in the dataset. The Actuals ends in one month and the Prediction starts in the next month, so there is no data in between as the data is set at a monthly level of time detail or granularity.


